This article is intended to help the reader develop an understanding of Phase in Vibration Analysis, the concept of phase as it applies to vibration and signal analysis. Simple examples are presented to demonstrate the basics of phase relationships; then machinery diagnostics and troubleshooting examples are presented. The idea of a complex spectrum is discussed, and various methods for display of complex spectra are illustrated. Finally, the article illustrates simple mode shape and operating deflection shape determination using vibration spectrum measurements with phase.
Why Consider Phase?
Often when conducting routine vibration testing of machinery, the overall signal strength (a broad-band reading) is measured as a first step. Actual machinery diagnostics however, requires narrow-band signature analysis to identify specific peaks in vibration spectra. In the same way that narrow-band signature analysis reveals another layer of information, phase information can provide even more clues when diagnosing machinery and structural problems.
What Is Phase?
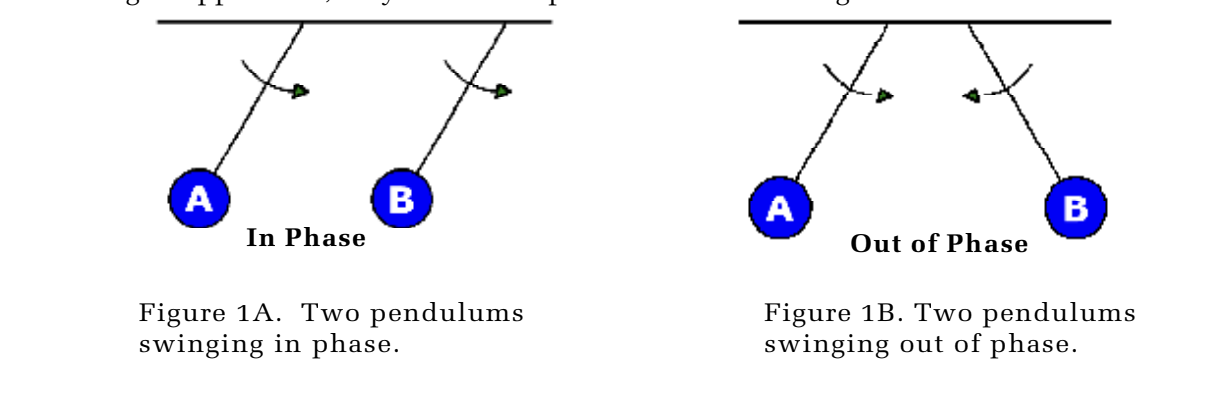
A simple example is a pair of pendulums. When they are set so that they swing in unison, they are said to be “in phase” as shown in Figure 1A, and if they are set to swing in opposition, they are “out of phase” as shown in Figure 1B.
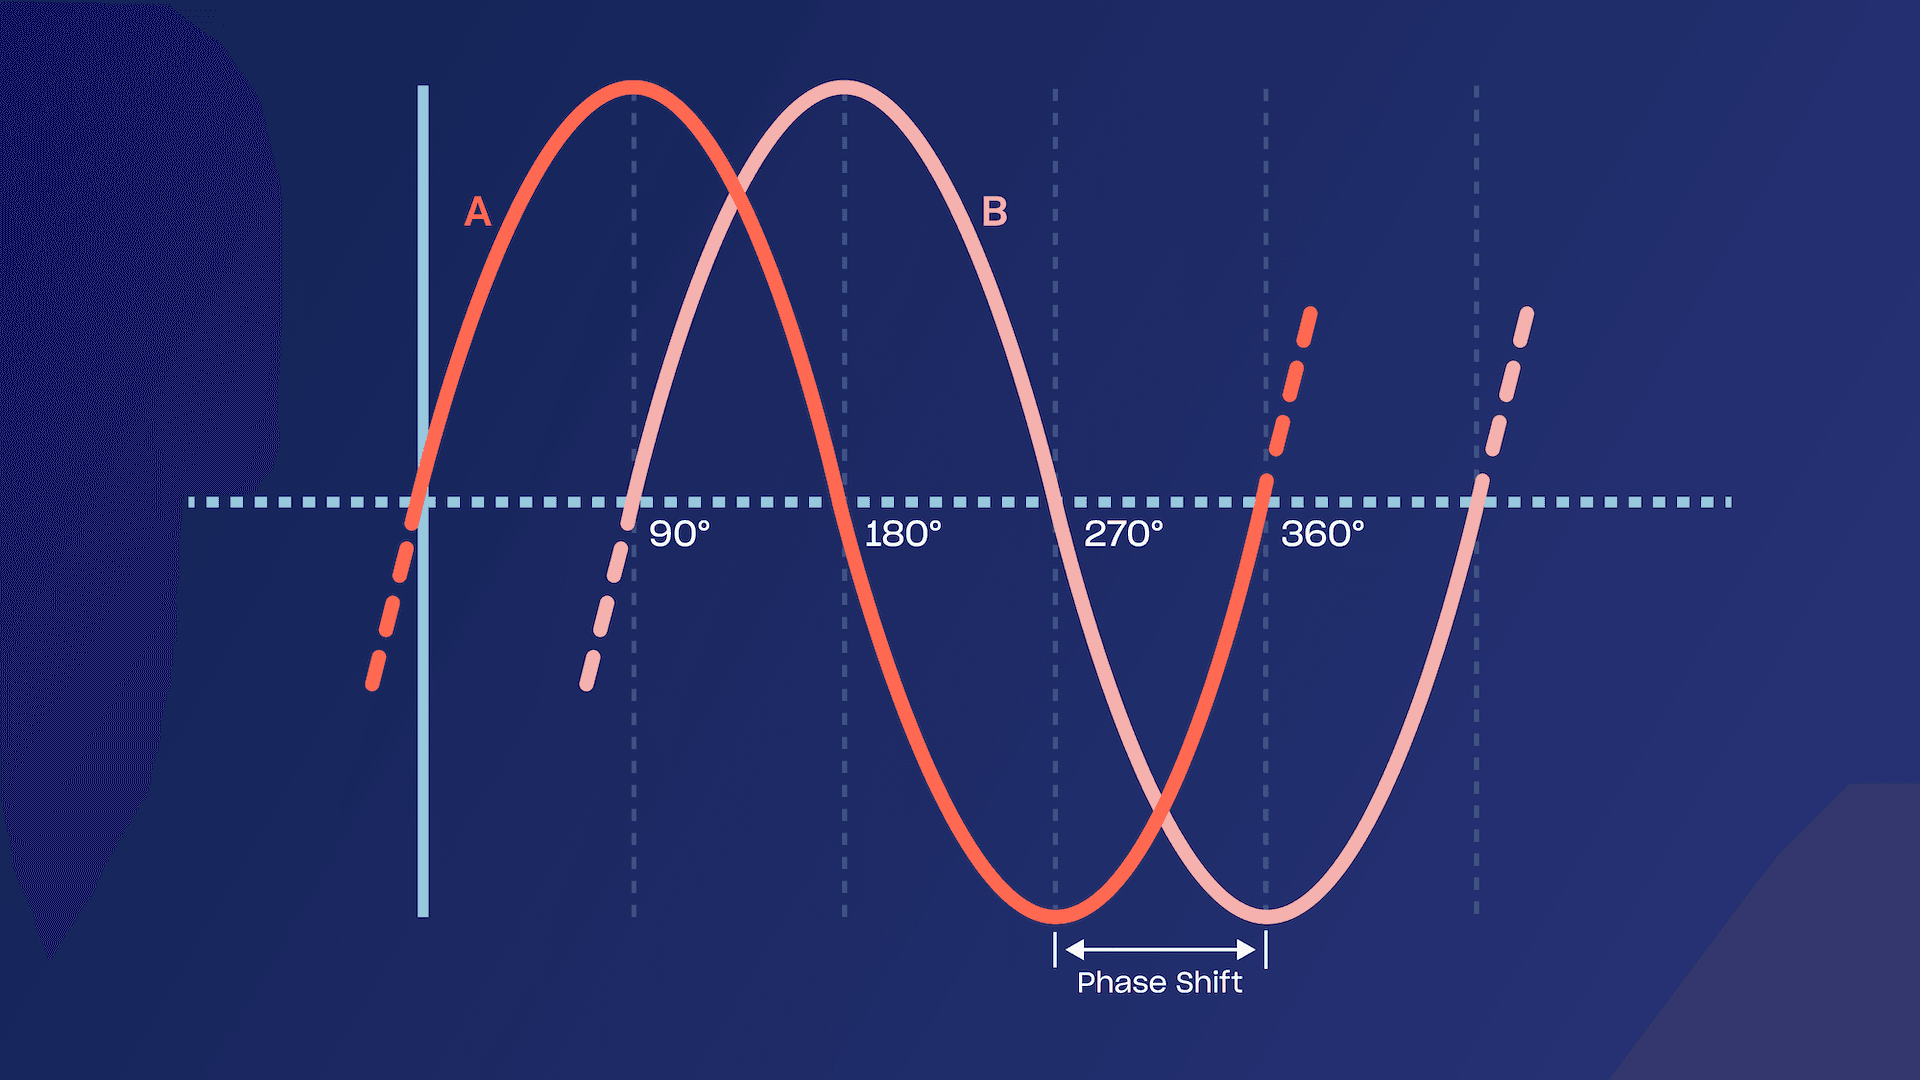
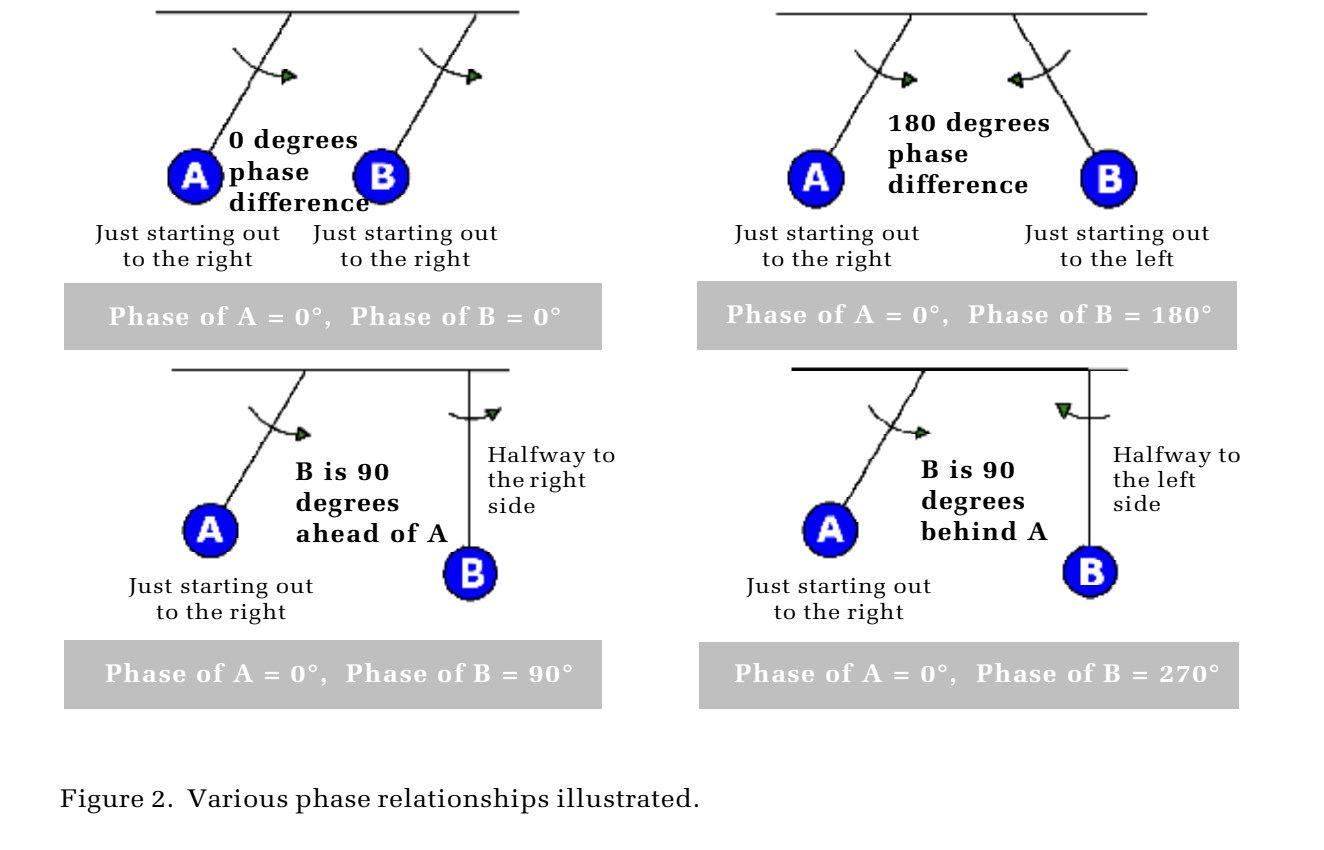
Of course there are infinite conditions that exist between in phase and out of phase. These conditions are described using angles such as “90 degrees phase difference” for example. If you consider the left side stop position as zero phase point, then the pendulum is at 180 degrees phase when at the extreme right, and continues on to 360 degrees as it proceeds back to the left hand extreme.
Here are some examples:
Frequency
If the pendulums are swinging at the same frequency, then their phase difference will always be the same. If not, their phase difference will be changing with time. Normally when talking about phase, we confine ourselves to one single frequency and if the motion or vibration is in a steady state, then the phase won’t change with time.
Real world applications
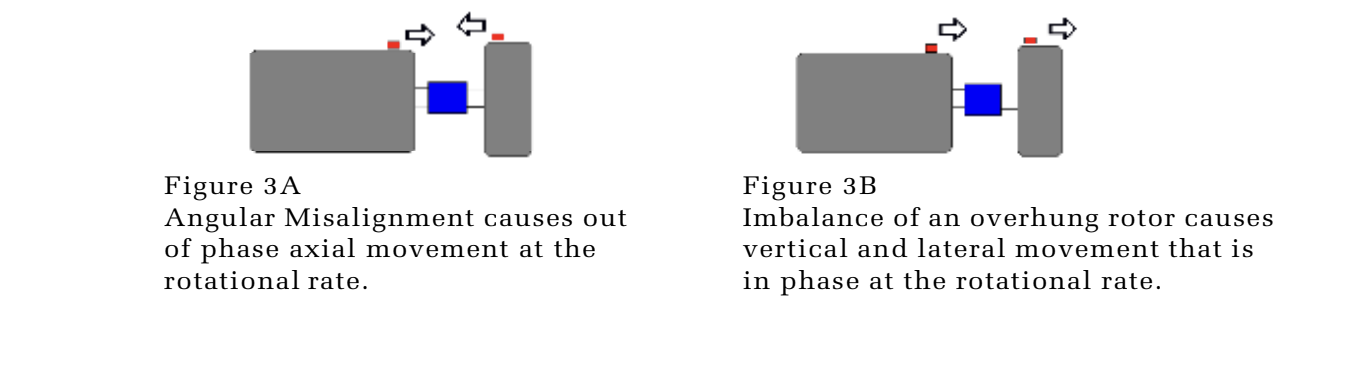
Jumping from our simple pendulum to the real world, phase difference between two points on a machine reveal useful information. For example, if a machine with an overhung rotor is vibrating excessively at its rotational rate, the vibration could have several different causes, i.e. imbalance, wobble, or misalignment. Observing the phase at two points on opposite sides of the coupling can help differentiate the actual problem. Imbalance and/or wobble will result in “in phase” rotational rate vibration at the two measurement points (Figure 3B) and misalignment will cause out of phase vibration (Figure 3A).
Use of phase for balancing
When doing dynamic balancing, the vibration of a rotating machine is recorded along with a tachometer signal (sometimes referred to as a key-phasor). The tach signal works like pendulum A in the illustrations shown in Figure 2, it serves as a zero point or datum.
During the balancing process, the rotational rate vibration is recorded and its phase difference relative to the tachometer signal is noted. Then by adding trial weights at known angles relative to the marking used to generates the tach signal, and recording the resulting magnitude and phase shift in the rotational rate vibration, a computer program indicates where a balance weight should be placed to minimize imbalance vibration.
Complex spectra
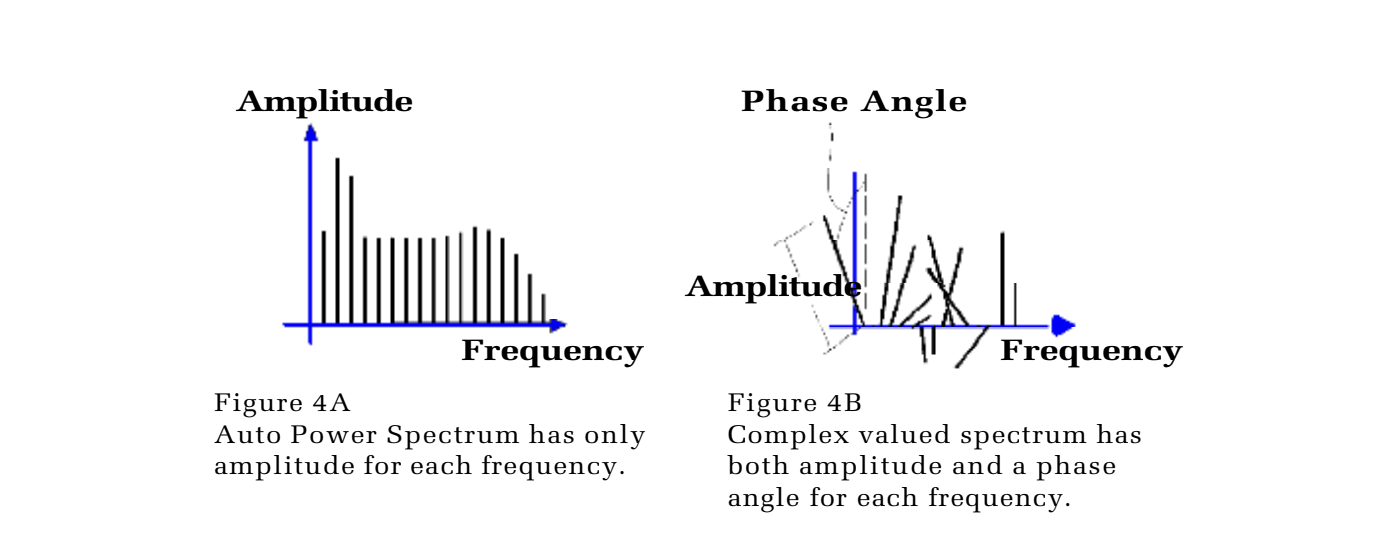
Narrow band vibration analysis involves close inspection of vibration spectra. The usual representation of these spectra are “auto power spectra” which puts everything in 2 dimensions. The vertical dimension is the amplitude of vibration (i.e. mils, ips, VdB, G, mm/s… etc.), and the horizontal dimension is frequency (0 to 200 Hz for example). The frequency range is divided into frequency bins or lines of resolution. Typically you will see 400, 800 or 1600 lines of resolution and for every line, there is a discrete amplitude. Behind the scenes however, there are phases associated with every line. These phases are removed when the “auto power” operation is done, but the information is retained in a “complex” spectrum. The complex spectrum has a third dimension, phase. For every discrete frequency, there are 2 pieces of information, phase and amplitude.
Magnitude and Phase Plots
The diagram shown in Figure 4B illustrates the difficulty in displaying complex spectra. Generally complex spectra are depicted by two 2D graphs, one showing just the magnitudes and the other showing just the phases for each frequency bin. This kind of depiction is referred to as a Bode plot. Alternatively, if one were to look down the horizontal axis of Figure 4B (directly at the arrowhead) and connect all the end points of the vectors with a line, you would get a Nyquist plot.
Here are some examples of 2D graphs depicting the components of complex spectrum:
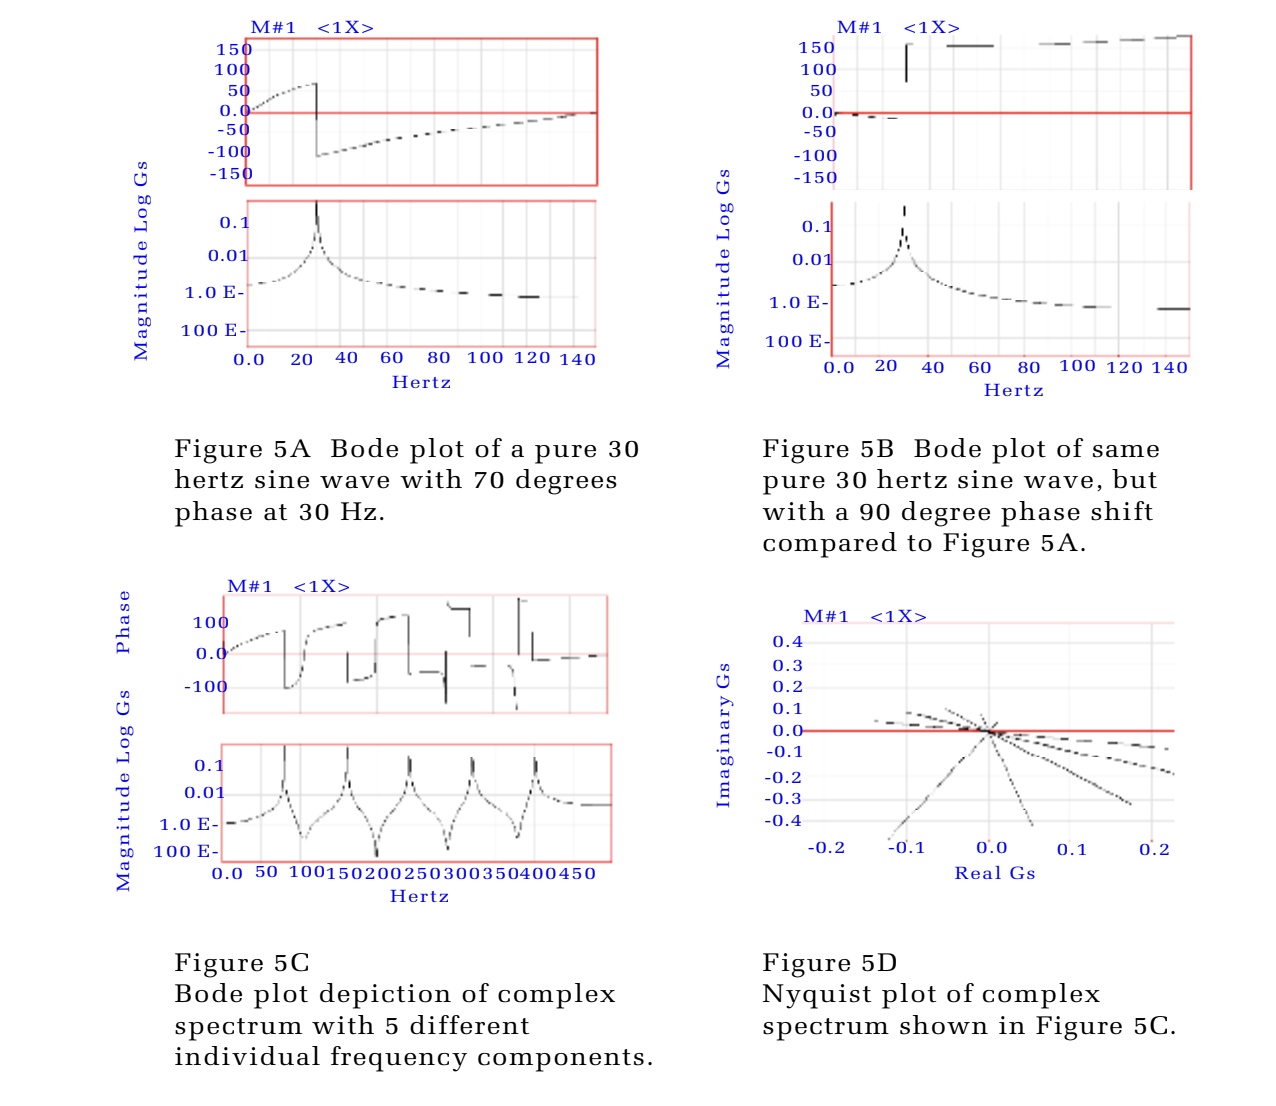
Real and Imaginary
Note that the Nyquist plot shown in Figure 5D is labeled not with phase or magnitude, but real and imaginary. Refer to Figure 4B and note that if the view were not from an angle, but directly from the side we would see something similar to what is shown in Figure 4A, but only the vertical components of each line would be visible. Conversely if we look at it from the top down, we would also see a 2 dimensional projection of just the horizontal component of each line. These vertical and horizontal views are technically termed the real and imaginary parts respectively. We can view the real and imaginary parts of any complex spectrum. Figures 6A, B, and C compare the real and imaginary plots with the bode plot and the autospectrum which lacks phase information. Figure 6D is the Nyquist plot of the same signal.
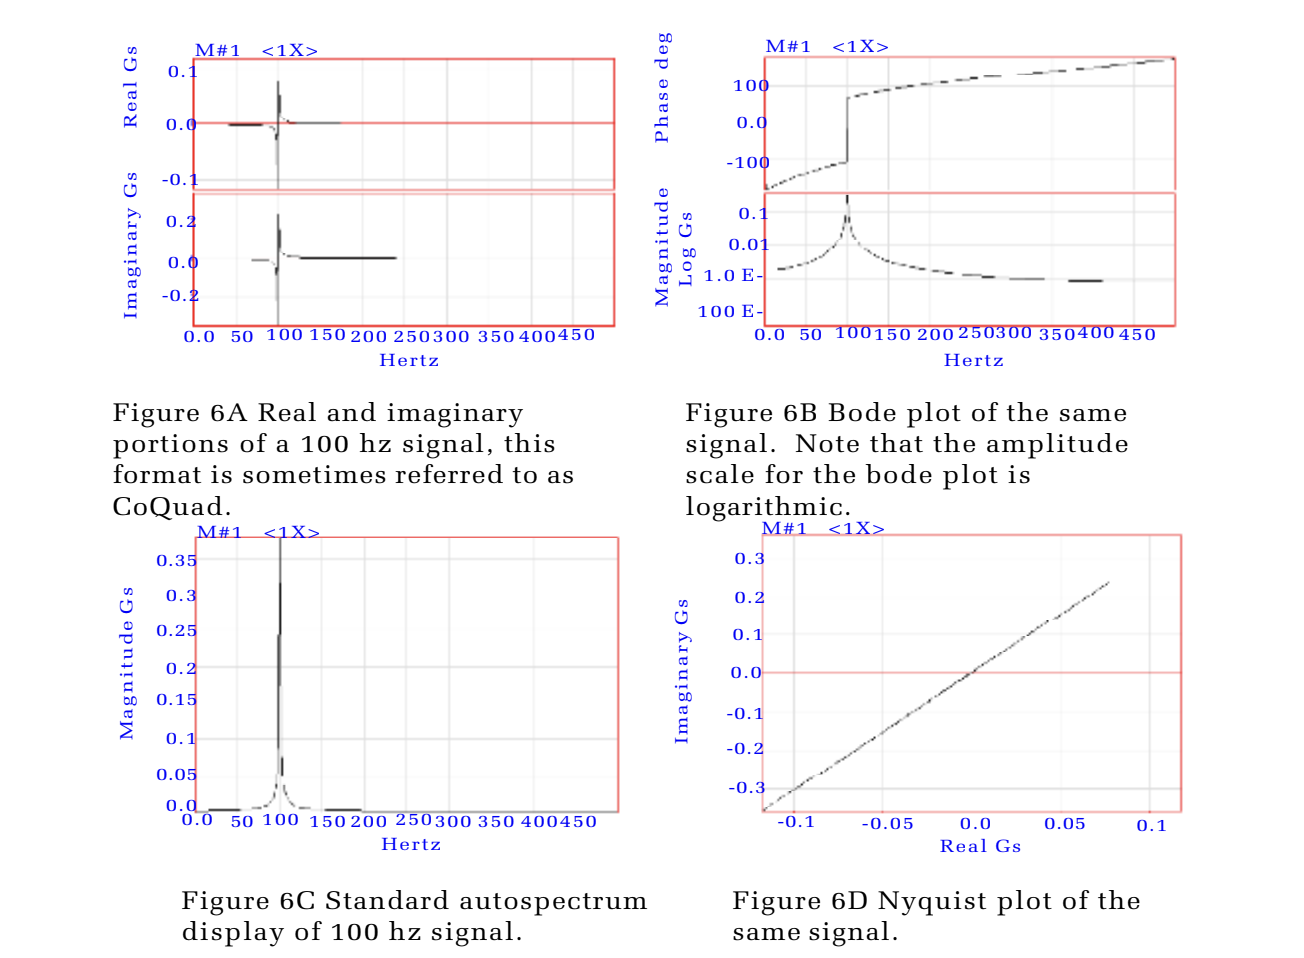
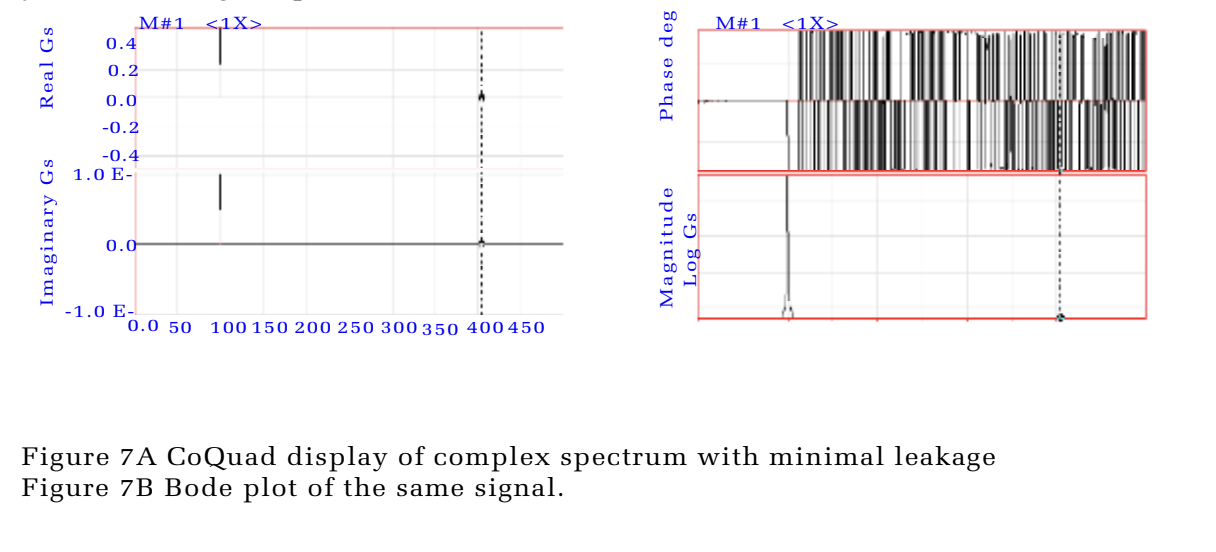
These examples, while smooth and clear are not representative of the way real signals look. The sudden shift in phase (see top of Figure 6B) before and after 100 Hz is due to something known as leakage. Leakage occurs when a signal has a frequency that is between 2 frequency bins of the spectrum. The following plots (see Figures 7A and 7B) are examples where the signal frequency is centered on a particular spectrum bin. Note that in the Bode plot, the phase jumps around randomly after about 110 hertz because the only bins with any real information are around 100 hertz. All other bins have small values corresponding to the computational error, built into the Fast Fourier Transform (FFT) process, which yields meaningless phase values.
Checking for phase at a particular frequency Normally, for routine vibration analysis, phase information is needed for one or two particular frequencies of interest, such as the rotational rate or some system resonance frequency or the frequency of a particular external excitation source. Most spectrum analyzers provide cursors that display the magnitude and phase at any particular frequency, additionally some data collection devices will record and report the phase at a particular frequency, without necessarily saving the complex spectrum.
Deflection and mode shapes: Determining the magnitude and phase at a fundamental frequency for several points on a structure can provide enough information to calculate the stresses and strains in the structure. Knowing the stresses can assist in determining root causes of structural fatigue and failure.
Conclusion
Phase is more than just an abstract concept in vibration analysis — it’s a practical tool that reveals what amplitude alone cannot. From identifying imbalance and misalignment to understanding complex spectra and deflection shapes, phase measurements provide an extra dimension of clarity when diagnosing machinery health. By combining amplitude and phase, analysts can uncover root causes, reduce guesswork, and make more confident decisions about maintenance and repair.
Content Courtesy of Fluke Reliability. Optimal is a Fluke Reliability Platinum Partner.
Curious how this service applies to your business? Contact us at enquiries@optimal.world | www.optimal.world
Home | Case Studies | About Us | Blogs | What We Do